INTRODUCTION
THIS is the first major historical atlas of the United States and probably the most comprehensive work of its kind that has yet been published for any country. Its aim is to illustrate cartographically, in manageable compass, and yet with considerable detail, essential facts of geography and of history that condition and explain the development of the United States. There are, of course, no absolute criteria by which we may measure the relative importance of historical events. Historical judgment, however, must rest on the recognition of fundamental relationships in space as well as in time, and these are often made intelligible through the medium of maps.
Scope of the Atlas
In many respects the history of the United States reflects our European origins. In other respects our national development has been distinctive and exceptional if not unique. These two sides of American history are well represented in the Atlas. While the maps show how world-wide forces have operated on American soil, they also lay emphasis upon what is characteristic of the United States. In Europe the foundations of national life were laid far back in the Middle Ages or earlier. America is nearer its beginnings. The chronicle of material expansion is a large part of its record. The nation has just emerged from the pioneer epoch, and it is fitting that stress should be laid upon the frontier aspects of its history: the story of the exploration and charting of mountains, rivers, lakes, and plains, of the spreading tide of settlement into vacant lands; of the friendly and hostile contacts between settlers and Indians; of the progress of settlement as it was fostered here and thwarted there by the great facts of nature; of the use made of natural resources; of the apportioning of land among individuals; of the adjustment of conflicting political claims to territory; and of the marking out of new administrative units. The sections of the Atlas dealing with the Natural Environment, Cartography (1492-1867), Explorers' Routes, Indians, Settlement and Population, Lands, and Boundary Disputes illustrate these topics and fill more than half of the plates. In the following table, which shows the amount of space devoted to each of the major subdivisions of the Atlas, the topics just mentioned are listed first.
| Number of half plates | Per cent of total space | |
|---|---|---|
| (1) Cartography, 1492-1867, and explorers' routes | 38 | 16.8 |
| Settlement and Population | 28 1/2 | 12.7 |
| Lands | 27 | 11.9 |
| Boundary Disputes | 19 | 8.4 |
| Natural Environment | 9 | 4.0 |
| Indians | 7 | 3.1 |
| Total | 128 1/2 | 56.9 |
| (2) Agriculture, transportation, manufactures, and commerce | 31 | 13.7 |
| Political maps | 28 | 12.3 |
| Reform movements | 14 | 6.2 |
| Churches, colleges, and universities | 11 1/2 | 5.1 |
| Military history, etc. | 9 | 4.0 |
| Plans of cities | 5 | 2.2 |
| Total | 98 1/2 | 43.5 |
| Grand total | 227 | 100.0 |
Function of the Text
The text gives references to the sources of information upon which each map is based. Wherever necessary critical comment is made upon the accuracy of the sources. How the maps were compiled and what the symbols show are pointed out where not self-evident-for the conventional signs are explained on the maps themselves and so far as possible made to tell their own story. Limitations in the method of representation are stated and explanations are made when necessary to avoid misconceptions. Some parts of the text run to considerable length, particularly the parts relating to lands and boundary disputes. Here the negotiations respecting disputed limits and areas are outlined and selections from the original documents quoted in full. Without such extensive comment the maps would be meaningless, but no attempt is made to interpret or explain the maps in broader historical terms. To have done so would have expanded the text beyond all reasonable measure. It would have been equivalent to writing a history of the United States from a geographical point of view, and the Atlas does not purport to be a "history." It is, rather, an aid to historians and to teachers and students of history. Not only will it be used as a reference book by those who wish to look up particular points, but original studies will undoubtedly be based upon the data that it presents. Each map is a refinement, as it were, of the raw materials for historical research, comparable to a document carefully edited with textual criticism but without historical interpretation. The text gives enough information to enable the reader fully to understand what the maps show, but often he must go farther afield if he would know what they really mean.
Contents of the Atlas
The main purpose of this Introduction is to give a rapid survey of the Atlas as a whole and to point out some of the relations between maps that deal with closely allied topics. In addition, a few suggestions will be made about the interpretation of some of the maps.
The Natural Environment
The first seven plates illustrate the natural environment in relation to American history. Natural circumstances have at all times offered to the American people tremendous material advantages. They have also placed definite limitations upon the range of man's activity. These plates have been introduced to illustrate environmental advantages and limitations rather than to prove any thesis that physical geography is either more or less effective than inherited tradition in shaping institutions and character.
Position, topography, climate, soils, vegetation, and mineral wealth are the outstanding elements of the natural environment directly affecting human endeavor. The five maps on Plate 1 show the position of the area comprising the United States, especially with reference to the Atlantic Ocean and Europe. A projection was chosen that seems well adapted to make this clear. Incidentally the maps also show where the United States lies in relation to certain natural regions into which the earth's surface may be divided, to winds and ocean currents, and to the limits within which some of the world's principal crops are grown. Plate 1 enables the reader directly to compare the environments of the Old and New Worlds. It seems appropriate that the Atlas should begin and end on a broad theme. The opening plate discloses some of the larger physical relationships of the area of the United States and the closing plate (Pl. 166) shows far-flung interests that the United States has acquired in many outlying parts of the world.
Plates 2-7 deal with the natural environment within the limits of the continental United States (excluding Alaska). Topography is the subject, first, of a simple relief map (Pl. 2A) showing altitudes. Indispensable in itself, this would be insufficient if allowed to stand alone, for a mere relief map does not tell enough about the forms of the earth's surface. These forms are likely to mean much more to the dwellers on the land than their elevation above sea-level. All plains, all plateaus, all mountain ranges are not alike in their sculpturing. For this reason a map (Pl. 2B) showing physical divisions, or physiographic provinces, has been placed alongside the relief map. As the physiographic map shows merely the boundaries of the divisions, a concise description of each division has been contributed by the compiler, Professor N. M. Fenneman, and will be found in the text.
Climate is so complex and bears so directly upon nearly everything man does that no less than sixteen maps (Pls. 3E-5) are devoted to the climate of the United States. Although geographers and climatologists have marked out climatic provinces on the earth's surface, it was believed that several maps representing separately a variety of climatic elements would be more expressive than a single map of climatic provinces with the necessarily long and technical explanation that would have to accompany it. From the included maps the student may draw up for himself a statement summarizing most of the essential facts aboutthe climate of any place in the United States; he may determine whether it is warm or cold, rainy or dry; and he may also learn something of special climatic elements-such as winds, length of growing season, droughts, snowiness, and cloudiness-each closely correlated in one way or another with farming, transportation, and manufactures.
The maps for soils (Pl. 2C), vegetation (including forests) (Pls.2D-3D), and mineral resources (Pls. 6 and 7) require no special comment.
Cartography, 1492-1867, and Exploration, 1535-1852.
The historical part of the Atlas opens with a series of reproductions of old maps intended to illustrate the gradual widening of geographical knowledge of North America. The first (Pl. 8), a reproduction of the gores of Martin Behaim's globe, 1492, shows us geographical concepts of the western hemisphere prevalent in Europe on the eve of the discovery of America. Of course it was well known at the time that the earth is a sphere, but so far as America is concerned the Behaim globe is a blank. On it a broad, uninterrupted ocean spreads from western Europe to eastern Asia. Nearly four centuries were to pass before this blank was completely filled in with the outlines of coasts, river systems, lakes, and mountain ranges in the forms with which we are now familiar. Plates 8-32 show how these forms took shape.
The format of the Atlas and the sizes and shapes of the original maps reproduced have rendered it impossible to arrange these reproductions of early maps in strictly chronological order. By classifying the maps in groups we may often study them to somewhat better advantage than when we examine them in the order in which they actually appear on the plates. For example, the maps illustrating Cartography, 1492-1867, might be grouped in two primary categories: (1) general maps summarizing how much was known of large areas at different times, and (2) special maps of more limited areas.
1. General maps. The six earliest maps in this category, all dating from before 1540, show the West Indies and portions of the Atlantic coasts of North and South America. They are as follows: La Cosa, 1500 (Pl. 10), the first map showing the results of Columbus' discoveries and those of John Cabot; Cantino, ca. 1502 (Pl. 9); Maggiolo, ca. 1519 (Pl. 11A); Turin, ca. 1523 (Pl. 17B); Verrazano, 1529 (Pl. 13); and Harleian, ca. 1536 (Pl. 14A). The Verrazano and Harleian maps both depict a vast inland sea in the interior of North America, and the Harleian map, in addition, shows the estuary of the St. Lawrence in some detail.
The maps of the next group in the first category date from 1546 to 1600 and cover either the whole or the major part of the North American continent. On the Gastaldi map, 1546 (Pl. 12B), North America is drawn as a great southeastward continuation of Asia. Mercator in 1569 (Pl. 15) separated the continents by a narrow passage, the mythical Strait of Anian. On Mercator's map, however, North America is still much too broad from east to west. By the time of Hakluyt, 1587 (Pl. 14B), and Ortelius, 1589 (Pl. 11B), the distortion has been largely eliminated and the passageway between North America and Asia is much broadened. On the Molineaux-Wright map of 1600 (Pl. 17D) the cartographer frankly recognized that he knew nothing of the northwest coast and did not attempt to continue it north of California. The Molineaux-Wright map is also the earliest map reproduced in the Atlas giving any indication of the Great Lakes. The Tattonus map, 1600 (Pl. 17E), is one of the earliest maps with the name California on the peninsula of Lower California.
For the seventeenth, eighteenth, and nineteenth centuries eight general maps are shown: Hondius, 1630 (Pl. 20A), Delisle, 1700 (Pl. 22A); Delisle, 1718 (Pl. 24); Popple, 1733 (Pl. 27), Bellin, 1743 (Pl. 23C); Delisle, ca. 1750 (Pl. 23B); Arrowsmith, 1814 (Pl. 29). Delisle's map of 1700 (Pl. 22A) summarized knowledge acquired during the preceding century by French and Spanish explorers of the Great Lakes and the course of the Mississippi. Arrowsmith's map of 1814 incorporates the results of the Lewis and Clark expedition (1804-1806). It also shows how little was then known of the southwestern states.
2. Special maps of relatively restricted areas. These may be further subclassified into six groups: (1) early maps of the coasts of the Gulf of Mexico and southeastern United States, 1520-1700-Cortés, 1520 (Pl. 17A); De Soto, ca. 1544 (Pl. 12A); Lemoyne, 1591 (Pl. 16); Gentil, ca. 1700 (Pl. 22B); (2) seventeenth and eighteenth century maps of northern and eastern North America, 1612-1755-Smith, 1612 (Pl. 18A); Champlain, 1612 (Pl. 18B); Smith, 1616 (Pl. 19A); De Laet, 1630 (Pl. 21); Champlain, 1632 (Pl. 19B): Sanson, 1656 (Pl. 20B); Delisle, 1703 (Pl. 23A); Evans, 1755 (Pl. 26); Mitchell, 1755 (Pls. 89-90); (3) seventeenth century maps of the Great Lakes-Jesuit, 1672 (Pl. 20C); Raffeix, 1688 (Pl. 20D); (4) seventeenth and eighteenth century maps of the Pacific coastVizcaino, 1603 (Pl. 17C); Müller, 1754 (Pl. 25A); Vancouver, 1798 (Pl. 25B); (5) maps showing in some detail the results of early nineteenth century explorations west of the Mississippi, 1810-1811-Clark, 1810 (Pl. 32A); Pike's map of the Rocky Mountain region, 1810 (Pl. 30A); Pike's map of the Mississippi River (Pl. 31C); and (6) more general maps showing the progress of geographical knowledge of the United States west of the Mississippi, 1804-1867-Lewis, 1804 (Pl. 28); Humboldt, 1811 (Pl. 30B); Bonneville, 1837 (Pl. 31A); Chapin, 1839 (Pl. 32B); Greenhow, 1840 (Pl. 31B); Smith, 1843 (Pl. 32C); Colton, 1867 (Pl. 32D).
For the progress of exploration in those parts of the United States lying west of the Mississippi the Atlas includes not only the reproductions listed above but also three maps showing the routes of Spanish, French, and American explorers, 1535-1852 (Pls. 38-39). Ninety-one routes are marked, and the route of each of the French and American expeditions is described briefly in the text. The series for explorers' routes comes down to 1852; that for Cartography closes with a map for 1867. By this time the major topographical features of the United States-mountains, rivers, plains, deserts, lakes-were known, at least in their outlines.
Indians.
The North America of the explorer and pioneer was not an uninhabited wilderness. The Indians were often an obstacle-at times a serious one-in the way of the advancing settler. The four maps on Plate 34 show the locations of hostile encounters with the Indians from 1521 to 1890, and, thereby, the progressive movement of the zone of Indian warfare westward with the advance of the frontier. More peaceful contacts with the aborigines are recorded on maps covering Christian missions to the Indians, 1567-1861 (Pl. 37), lands ceded by the Indians to the government, 1750-1890 (Pl. 47A), and Indian reservations, 1840-1930 (Pls. 35-36). The Indians differed greatly among themselves in character, language, customs, and degree of civilization, and these differences often meant much in the relations of the settlers and government to the several tribes. A map on which are marked the areas occupied by Indian tribes and linguistic stocks about 1650 has therefore been included (Pl. 33). During the succeeding centuries many of the tribes shown on this map were exterminated, and others were forced to migrate as hunting-ground after hunting-ground was taken from them.
Lands.
A supremely important chapter in American history deals with questions of land. Except for the Indian's shadowy claims, which in the long run were easily swept aside, a boundless domain until recently lay open for governments, companies, and individuals to seize and subdivide and use. In the process divergent policies, practices, and conflicting interests arose, affecting in some degree the entire social, economic, and political history of the nation. Questions of land are treated in three separate parts of the Atlas, the sections entitled "Lands, 1603-1930" (Pls. 40-59), "States, Territories, and Cities, 1790-1930" (Pls. 61E-66), and "Boundaries, 1607-1927" (Pls. 89-101).
As in the case of the history of cartography, the maps for lands and territorial questions may be classified systematically.
1. Territorial questions of international significance. This group includes maps showing the possessions of European states in North America after 1763 (Pl. 41A), British possessions after 1774 (Pl. 46A), territorial claims and limits on the northwest coast, 1790-1846 (Pl. 49), and territorial acquisitions of the United States, 1783-1853 (Pl. 46C). These are all in the section "Lands, 1603-1930." However, the maps in the section "Boundaries, 1607-1927," covering the negotiations for peace, 1783 (Pls. 89 and 90), and the more important international boundary disputes to which the United States has been a party (Pls. 91-96) belong logically in this category, as well as the concluding map of the Atlas (Pl. 166), on which are shown possessions, claims, and dependencies of the United States in various parts of the world.
2. The evolution of the boundaries of the colonies, states, and territories. Land grants of European sovereigns to trading and colonizing companies and to great proprietors in the colonial period laid the foundations for the subdivision of territory between the several colonies and later between the states. The limits of the more important colonial grants are drawn on two general maps (Pls. 42 and 43A) and the boundaries between the colonies are indicated on Plate 61A-D. More detailed illustrations of two great colonial land grants, one in Maine, the other in Virginia, are given on Plates 44C and 51A. In the royal charters the lands granted were frequently described as extending indefinitely to the west or as reaching to the Pacific Ocean. This meant conflicting claims to the western territory as soon as settlement was pushed beyond the Appalachian barrier. The adjustment of these claims forms the topic of Plate 47B-E. Certain colonies and states proposed or organized west of the mountains, 1775-1802, but not destined permanently to survive are shown on Plates 41C and 46B. On Plates 61E-66 the general evolution of the boundaries of the states and territories, 1790-1920, is recorded, and on Plates 97-101 some of the more troublesome disputes over boundaries between the colonies and states, 1607-1927, are analyzed in detail.
3. Lands ceded by the Indians to the British, colonial, state, and United States governments, 1750-1890. These Indian cessions are summarized on a single map of the United States (Pl. 47A).
4. The disposition of federal lands. This group comprises maps of the whole United States showing the public lands in 1790, 1810, 1830, 1850, 1870, 1890, 1910, and 1929 (Pls. 57-59), as well as lands granted to the states for educational and other purposes, 1785-1919 (Pl. 50A), military reserves (Pl. 45B), and federal land grants for the construction of railroads and wagon roads (Pl. 56D). In this group, also, belong certain detailed maps illustrating surveys, divisions, and grants of government land in different parts of the country at different times (Pls. 50B, 41B, 48A, 48C, 50E, 55D, 55C, and 56E, noted in chronological order).
5. The details of typical grants, surveys, divisions, and holdings of land, not otherwise covered under paragraphs 1-4, above. These miscellaneous reproductions may be grouped according to whether the originals date from (1) colonial period (Pls. 41D, 43B, 44B, 53C, 40, 51A, 44C, 44D, 50D, and 51B) and (2) the national period (Pls. 50C, 53A, 45A, 53B, 48B, 44A, 53D, 41E, 52A, 52B, 56C, 55A, 55B, 54, 56A, and 56B). For each period the maps are listed in chronological order.
Population and Settlement.
After the section entitled "Lands, 1603-1930," comes a series of plates devoted to the history of population. Three movements are here shown: (1) the progress of settlement as a whole, 1660-1930; (2) the rise of towns and cities, 1650-1930; and (3) the changing composition of the population, 1790-1930. Settlement as a whole is treated differently for the period 1660-1775 than for the subsequent period. The five maps on Plate 60 show settled areas in 1660, 1700, 1760, 1775, and 1790, but owing to the lack of detailed statistics it was not feasible to map the density of population for any but the last of these dates. The five maps, however, indicate by globe symbols the approximate total population of each colony. For the period 1790-1930 the United States government has taken a census of population every ten years, and it was possible to include a map for each census year showing the density of population by counties (Pls. 76B-79D). The lines on these maps between areas having more and those having less than two persons per square mile mark-very roughly to be sure-the successive positions of the "frontier" in its march across the continent. The steady, almost due-westward course of the center of population from the vicinity of Baltimore in 1790 to southwestern Indiana in 1930 is shown on Plate 80A.
On Plates 61-67A space was economized by marking on the same maps both colonial and state boundaries and the locations of towns and cities. These maps cover the years 1650, 1700, 1750, 1775, 1790, and every tenth year after the last-named date. The towns and cities on the maps for 1790-1930 are represented by dots of two sizes, smaller dots for places of 5000-100,000 inhabitants and larger ones for places of over 100,000. Perhaps a somewhat more graphic effect might have been achieved had it been practicable to separate the two elements-political units and cities-and to employ a greater range and variety of symbols to distinguish the towns and cities according to size. These maps will repay careful comparison with the maps showing relief, physical divisions, climatic factors, and mineral resources, all circumstances upon which the location and grouping of cities are closely dependent. As regards the composition of the population, maps are included for negroes and foreign-born. The percentages of slaves in the total population are shown for every census year from 1790 through 1860 (Pls. 67B-68B), and the percentages of colored persons in the total population for 1880, 1900, and 1930 (Pls. 69B-70B). The number of free negroes is mapped for 1810 and 1860 (Pls. 68C-69A). Plate 70E-O shows how many immigrants came to the United States from the different countries of Europe decade by decade from 1831 through 1929. Plates 71-76A reveal where the foreign-born have settled since 1860 and, more specifically, where Germans, Irish, and Swedes and Norwegians have settled since 1880. Based upon statistics by counties, the maps for densities, negroes, and foreign-born give a detailed picture of the distribution of these elements in the population.
Politics and Reforms.
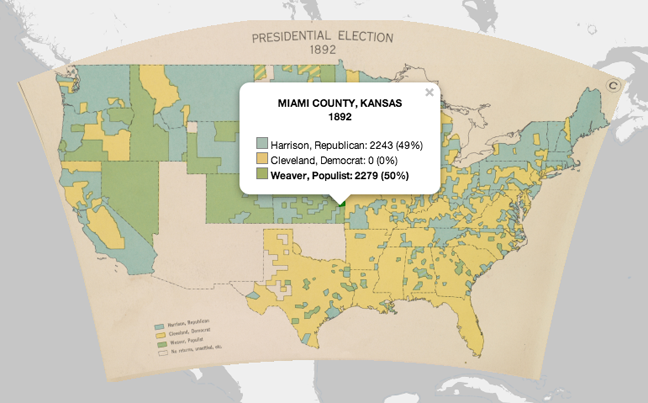
The political maps (Pls. 102-122) are the results of a far more exact and detailed type of research than their clear and simple appearance would at first suggest. They set forth the shifting alignments of political sentiment in different sections and show where local interests have often diverged from the prevailing sectional interests. They express the geographical distribution of parties and political opinion in terms of the smallest feasible territorial units-counties in the case of the maps of Presidential elections (with some exceptions) and Congressional districts for the maps representing the votes in the House of Representatives. All Presidential elections are mapped, as well as the votes on no less than thirty-six important Congressional measures. Close study of these maps will undoubtedly disclose significant relationships between politics on the one hand and physical and human geography on the other. It will also serve to correct many false ideas and unfounded generalizations. The maps, for example, make it quite clear that the Solid South has not always been as "solid" in voting for presidents as was once thought to be the case. The consistent opposition of the Southern congressmen to high tariff measures as revealed by a quick survey of the Congressional series is striking indeed. Curiosity is aroused by the detail on these maps. One would like to know what accounts for certain distinctive patterns on successive maps of Presidential elections and why these patterns break up to give way to new patterns at later dates.
The political maps are followed by a series illustrating political and social reforms as brought about chiefly by state legislation: the abolition of slavery (Pls. 123-124A), the elimination of property qualifications for suffrage (Pls. 124B-126B), woman suffrage (Pls. 126C-128A), prohibition (Pls. 128B-131A), labor legislation (Pl. 132), and primary and secondary school education (Pl. 131B-E). On the maps for woman suffrage and prohibition it is impressive to see how these great movements have swept across the country-woman suffrage like a giant wave rolling from west to east; prohibition in two successive tides, the tide of local prohibition spreading eastward and westward from a central tier of states, followed by a dry tide flowing from the South and West.
Cultural Development.
There is available for the educational and religious institutions of the United States a large quantity of statistical material much of which lends itself to cartographic treatment. The series of dot maps showing the distribution of churches by denominations in 1775-1776, 1860, and 1890 (Pls. 82-88), and of colleges and universities in 1775, 1800, 1830, 1860, and 1890 (Pls. 80B-81) represent a selection from among a very wide range of topics that might have been mapped to illustrate the cultural life of the nation. Expenditures for schools by states indicate roughly (as shown on Plate 131B-D) nation-wide tendencies and sectional divergencies in primary and secondary teaching, but it should be remembered that the efficiency of schools is not measured by per capita expenditures, compulsory attendance, and minimum term laws (P1. 131E) alone.
Economic History.
The economic history of the United States is covered in part by the maps already mentioned in connection with the section "Lands, 1603-1930." The maps recording Congressional votes on the tariff, transportation, finance, and other economic measures also throw light on this broad subject. On Plates 133-155 maps will be found for industries, foreign trade, and wealth.
Under the general heading "Industries" about equal space is given to manufacturing (Pls. 133-137), transportation (Pls. 138-141), and agriculture (Pls. 142-147). The aim is to illustrate the general progress of each of these three groups of industries and incidentally to show something of the development of certain of the leading individual industries that compose each group.
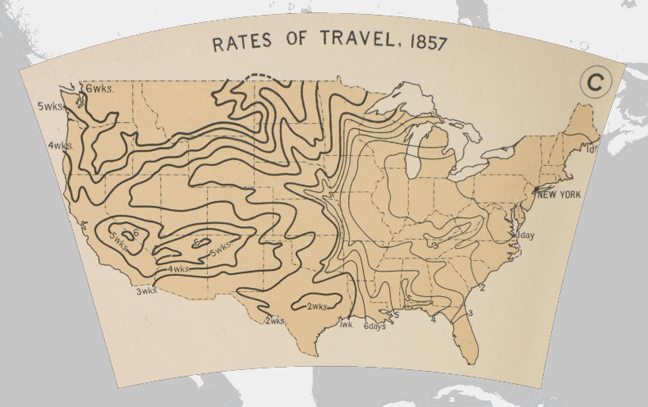
For mapping the general progress of manufacturing (Pls. 133-134D) two criteria were chosen: (1) the growth of the principal manufacturing cities, 1839-1919, as measured by the number of wage earners; and (2) the increase in value added by manufacture, by states, in 1849, 1880, and 1927. The history of individual manufacturing industries is illustrated on Plates 135-137, where maps will be found for different dates showing iron and steel works, number of cotton spindles, and manufacture of motor vehicles. Improvements in the mechanism of transportation are reflected on the maps showing the length of time taken in 1800, 1830, 1857, and 1930 for passengers to reach different parts of the country from New York by the ordinary means of travel in use at each date (Pl. 138A-E). More detailed maps follow for canals and navigable rivers, the widening network of post routes, railroads, and air mail routes (Pls. 138F-141J). The rapid rise of motor travel and transportation during the last two decades may be inferred from two maps (Pls. 141 K and L) indicating for each state the number of persons per motor vehicle in 1913 and in 1930. The general progress of agriculture from 1850 to 1930 is to some degree summarized in a series (Pls. 144C-146M) revealing the total acreages and the changes in the acreages of improved land and of land in harvested crops, decade by decade. Maps will also be found showing the production of individual crops since 1839 (Pls. 142B-144B), farm tenancy since 1880 (Pl. 146N-Q), and farm values since 1850 (Pl. 147).
To the subject of foreign trade two series are devoted. One (Pls. 148-151C) shows the value of exports and imports as they have flowed through the ports of entry of the colonies and the United States. The mapping, however, is by states and colonies rather than by ports. Exports and imports from England are shown for 1701-1710 and 1765-1774, imports from England for 1791-1800, all exports for 1791-1800, and all exports and imports for the decades 1821-1830, 1851-1860, 1871-1880, and 1901-1910, and for the nine years 1921-1929. The second series (Pl. 151 D-G) comprises four maps of the world on which globe symbols depict the values of exports to and imports from the United States by continents and larger subdivisions of the continents, decade by decade from 1821 through 1920 and for the nine years 1921-1929.
As a basis for mapping the distribution of wealth the following sources of information were used: statistics by states, of wealth in terms of the value of houses and lands in 1799, of taxable property in 1850, and of all property in 1880, 1912, and 1922; statistics by states, of federal income taxes in 1866 and 1928, and of bank capital in 1801, 1830, 1850, 1880, 1910, and 1928; and a variety of documents relating to banks. From these sources maps were compiled showing total and per capita wealth (Pls. 152-153), income taxes (Pl. 155), and bank capital by states (Pl. 154B, D, F, H, K, and L), and also a series showing distribution of banks (Pl. 154A, C, E, G, and J).
Plans of Cities.
On Plates 156-159 are reproduced plans of the seven principal cities of the United States at the close of the colonial or beginning of the national period. They furnish a means of identifying places where events of historical importance occurred, and are of interest as illustrations of different systems of early town planning.
Military History.
Plates 160-165 cover the colonial wars and military history of the United States. Most maps illustrating wars and campaigns are confused and difficult to follow, especially when a tangle of lines on them is intended to show troop movements. Particular care was taken in arranging the maps of military history and in devising for them a scheme of conventional signs that so far as possible would tender them self-explanatory.
World Relationships.
The concluding plate (Pl. 166), as we have seen, like the first, takes us beyond the boundaries of our country. It shows the United States in some of its larger world relationships-its possessions, claims, and dependencies in various regions, as well as the locations of certain military engagements in which American forces have taken part, and grounds formerly visited by American whaling vessels.
Statistical Maps and Their Interpretation
History is a record of movement and change. Most maps represent static conditions-the earth's surface at a given moment. A large problem in any atlas of historical geography is how best to record movement and change by means of the somewhat unadaptable medium of the map. The ideal historical atlas might well be a collection of motionpicture maps, if these could be displayed on the pages of a book without the paraphernalia of projector, reel, and screen.
To illustrate movement and change cartographically three devices are used in this Atlas. The simplest is the sequence of maps revealing progressive stages in a process-as, for example, the series showing density of population or votes in Presidential elections. Another device is to show on a single map conditions that prevailed or events that occurred at different dates-for example, the maps of boundary disputes, foreign trade, and military history.
It is to the third device that we should like to draw particular attention at this point. This device is used on one series, the maps showing increase and decrease in acreage of improved lands (Pls. 145C-146M). Each map here summarizes a process of change during a decade. The student's attention is focused directly upon the fact of change and upon regional differences in its amount rather than upon a total quantity or a ratio of one to another total, as on most statistical maps. While maps showing processes of change cannot in any way take the place of those representing static conditions, they may be effectively used to supplement the latter, since they often bring out in sharp relief the vital movements with which the historian is likely to be most immediately concerned.
Many of the maps in the Atlas are based upon statistical tables. Everyone who has critically studied such tables knows that statistics are often tricky. They may be misleading when used for comparing conditions prevailing at different dates, because they are not always equally accurate and their compilers are tempted to change the definitions of categories without adequate explanation. Furthermore, in interpreting maps based on statistics given in terms of monetary values it should be remembered that the price level-or, in other words, the value of the dollar-has constantly fluctuated. On several series of maps the symbols showing values have been standardized with reference to the value of the dollar at a given date, but this could not be done consistently. Though faith may be placed in the main outlines of the statistical maps, hasty conclusions should not be drawn from a scrutiny of their minutiae. Too refined comparisons should be avoided between different small areas on the same map and especially between the same area as shown on different maps.
Although no distinction in the text is made between maps and cartograms, several of the so-called "maps" are not strictly maps in the geographer's sense of the term. A cartogram is a cartographic outline upon which are drawn statistical symbols that do not conform closely to the actual distribution of the phenomena represented. Discs, for instance, are used on some of the "maps" on Plate 154 to indicate bank capital in the several states. These "maps" are cartograms. Had data been available for showing bank capital in each county by a separate disc the picture would have been more realistic and would have resulted in a series of genuine maps.It is sometimes difficult to draw a hard-and-fast line between maps and cartograms. Much depends on the scale. For a map, the larger the scale, the smaller must be the area represented by each symbol. So far as this Atlas is concerned, all "maps" where statistical data are shown in terms of units as large as a state may perhaps be regarded as cartograms; and those "maps" where the data are plotted by towns, counties, Congressional districts, etc., may be regarded as maps.
Some Cartographic Desiderata
In the preliminary plans and suggestions made by several scholars (see Preface) many maps were proposed for inclusion that for one reason or another had to be omitted. Since cartographical simplicity was regarded as a desideratum no complicated map illustrating many kinds of information was included. Furthermore, room was found for maps that illustrate only the most basic and essential parts of American history, and not for all of these. In all divisions maps were excluded because of the limits of space. Owing to inadequate statistics many desirable maps for the colonial period could not be made. Other maps were not made because of the great labor required to assemble the necessary information.
A few examples, however, may be given of avenues of research that might well be followed further in directions already marked out in the Atlas. While every phase of American history offers alluring possibilities of cartographic interpretation, special attention is here directed to the subjects of exploration, population, education, and economic development.
The series for the history of exploration closes, as we have seen, with the year 1852, but the mid-nineteenth century by no means marked the end of exploration. The period of intensive work that followed and is still in progress has yielded results of hardly less scientific and economic value than the period of pioneer mapping. During the sixties, seventies, and eighties of the last century the federal government conducted important topographical and geological surveys in the Far West. These were supplemented by the private ventures of transcontinental railroads and by state geological and natural history surveys. Out of the work of the federal government in the Far West developed the nation-wide work of the United States Geological Survey. More recently the federal and state governments have pushed far the mapping of soils, minerals, and forests, and beginnings are being made in the field of land classification maps. Were it not for unrivaled natural resources the United States could hardly hold the position it now occupies among the nations. The progress of the systematic exploration of these resources deserves to be illustrated by maps showing the routes followed by some of the more notable exploring parties and the areas covered by surveys of different types at different times, as well as by specimens of the large-scale maps published on the basis of these surveys.
The Atlas, as has been seen, provides a substantial foundation for the history of the peopling of the United States. Welcome, however, would be maps showing the more recent currents of immigration from southern and eastern Europe and from Mexico, or a series depicting movements of different elements in the population from one part of the country to another-as, for example, the filtration of settlers from the eastern seaboard colonies and states into the lands beyond the Appalachians, or the recent migrations of negroes to the northern cities and of white people from the north-central and northeastern states to southern California and Florida. The social and economic characteristics that differentiate the newer sections of the country are due in part to geographical circumstances but also in large measure to marked differences between the older sections from which the settlers came. The Census, unfortunately, assists us little in tracing these internal migrations. In order to follow them satisfactorily, deep delving into local history is needed.
An important combination of forces during the last century has brought about the rapid growth of cities as contrasted with the slow growth of rural districts and actual decline of the latter in many sections. On the maps in the Atlas a county with one or two large towns surrounded by a desert waste is in general represented by the same symbol as a county in which an equal number of people is scattered evenly among farms and small villages. Had unlimited space been available, separate maps might conceivably have been included for rural and for urban population, or, possibly, for rural, urban, and farm population. The steady growth of a single manufacturing or commercial town may completely obscure, on the existing maps, the fact that the surrounding rural areas lost population. Different cities grow at different rates, and there are large cities that have become smaller during recent decades. Progress or recession region by region or locality by locality might be recorded on maps making clear these differential rates of growth and decline, much as differential increases and decreases in the acreage of improved farm lands are shown on Plates 144C-146M.
The history of education in the United States offers a particularly attractive field for further cartographic study. Maps in the Atlas present certain details regarding colleges, universities, and secondary schools. Statistical data, however, exist upon which maps could be based showing other equally significant factors, such as the age limits within which children are required to attend school or the number of pupils per teacher. The most important element of all, classroom standards, is hardly capable of measurement in statistical terms, but criteria could doubtless be discovered by which this factor might be estimated and mapped. Higher education should ultimately be illustrated in greater fulness, as, for example, percentages of college graduates in the total population above the age of twenty-one and of women among all college graduates. The cultural status of different parts of the country could be compared on maps showing the number of public libraries per capita, the prevalence of illiteracy, and the distribution of talent and of leadership in science, in the arts, in business, and in public affairs. More or less successful attempts have already been made to estimate and map some of these things, but there is a genuine need for further studies of the same sort.
In the almost boundless field of economic history there are many cartographic desiderata. For example, maps are needed illustrating in more detail than was possible in the Atlas the history of production in the agri-cultural and manufacturing industries, the volume and direction of domestic commerce, and the exchange of goods in trade between different parts of the United States and between the country as a whole and other parts of the world. Maps differentiating railroads and waterways according to the amount of freight and passenger traffic, showing the geographical structure of freight rates and freight differentials, and routes taken and ports visited by ships of the American merchant marine would also be of value. The agricultural series covers certain material bases of farming, crop production, and improved land, as well as property values. The whole subject of farmers' organizations, however, offers almost virgin soil to the map-minded historian. The national and state granges, the farm bureaus and farmers' institutes, and cooperative selling and buying organizations have often been powerful agencies in promoting the welfare of the farmer or in giving voice to his political aspirations. The industrial destiny of the nation is in the hands of labor no less than of capital. The distribution of capital and some of the interests of labor, as they have found protection in reform legislation, are illustrated in the Atlas (Pl. 132); but organized labor has had to be passed by, in the main because of lack of available statistics. Maps covering membership in the American Federation of Labor, the Knights of Labor, the Industrial Workers of the World, and similar units; maps for particular industries-such as coal mining-showing where labor has been organized and where not, and where there have been strikes and other conflicts-all might help to illumine much that is still obscure in the industrial history of the nation. But it is hardly profitable to add to these examples. Another atlas could scarcely do full justice to the economic history of the United States from a geographical standpoint if anything approaching a detailed presentation of the subject were to be attempted. The present atlas attempts to cover the essentials.
The Making of the Atlas
In the preparation of the Atlas of the Historical Geography of the United States two disciplines have been represented, history by the work of the Department of Historical Research of the Carnegie Institution of Washington, and geography by the work of the American Geographical Society of New York.
The making of the Atlas was authorized by the Carnegie Institution in 1911, and work was begun in the following year when Dr. Paullin was employed for four months on a survey of possibilities and on other preliminary tasks. In 1913 he was placed in charge and from 1914 until 1927 gave all his time to the work, with the exception of a few intermissions caused by the World War and other exigencies. He was aided by numerous scholars of history and geography whose names and services are, for the most part, mentioned in the Preface.
In order that the Atlas might be further strengthened geographically and might benefit from the experience and technical skill of the American Geographical Society in editing and publishing maps, an arrangement was made in 1929 whereby the Society accepted the responsibility of bringing the enterprise to a close. Besides editing and seeing the publication through the hands of lithographer, printer, and binder, the Society has rearranged the material and has added, with the approval of the Carnegie Institution, a considerable number of new maps with corresponding text.
As first conceived the Atlas was to have been a bulkier and much more costly volume than the present one. A layout was planned for the entire Atlas on the assumption that the plates would measure rather more than half again as much in height and width as the present plates. Most of the maps were actually drawn on this basis. After very careful consideration it was decided that the size of the plates should be reduced and that space should be economized by printing maps on the backs of the plates. Accordingly, a new layout was prepared for all the maps. Under this new plan it has been possible to reproduce nearly all of the maps on approximately the scales first contemplated. Only a few large reproductions of old maps had to be substantially reduced, and these have suffered little, if at all, from reduction. In the sections on Cartography, Lands, and Boundary Disputes some rearrangement of the order of the maps was necessary. Otherwise the adoption of the new format has not altered the content of the Atlas in any way, though the economy of space effected has made publication possible at a price within the means of every scholar.
The American Geographical Society is also responsible for a few minor departures from the original plan in the sequence of topics and for the discarding of certain maps in order to leave space for new ones that for various reasons it seemed desirable to add. Some of the new maps were included to bring as nearly up to date as possible the several important chronological series already compiled by Dr. Paullin-for example, the series for population, agriculture, trade, Presidential elections, and votes in Congress. Others were introduced to round out somewhat more fully the treatment of particular topics. Many of the new maps were compiled on the basis of original investigations. Others are either reproductions or adaptations of existing manuscript and printed maps. A classified list of the items added by the Society follows.
1. Maps compiled by the American Geographical Society from statistics, other maps, or miscellaneous sources, and drafted at the Society:
a) To complete chronological series: Plate 36B, Indian Reservations, 1930; 59B, Distribution of Public Lands of United States, 1929; 67A, States and Cities, 1930; 70B, Colored Population, 1930; 72B, Foreign-Born Population, 1930; 73C, Foreign-Born Population, German, 1930; 74B, Foreign-Born Population, Irish, 1930; 76A, Foreign-Born Population, Swedish and Norwegian, 1930; 79D, Density of Population, 1930; 111D, Presidential Election, 1928; 122B, Smoot-Hawley Tariff Act, June 13, 1930; 151B, Imports, 1920-1929; 151C, Exports, 1920-1929; 155C, Federal Income and Profits Taxes, 1928, Total Taxes per state.
b) Illustrating new topics not covered under the original plan: Plate 1, North America in Relation to the Atlantic Ocean and Europe; 60, Settlement and Population, 1660-1790; 101A, Michigan-Wisconsin Boundary; 101C, OklahomaTexas Boundary along the Red River; 131B-E, Schools; 134B-D, Value Added by Manufacture, 1849-1927; 134E, Wholesale Prices, 1791-1930; 137B-C, Manufacture of Motor Vehicles, 1909, 1927; 141K-L, Persons per Motor Vehicle, 1913, 1930; 146N-Q, Tenant Farmers, 1880-1930; 147A-D, Average Value of Farm Lands and Buildings per Acre of All Lands in Farms, 1850-1930; 147E-H, Average Value of Farm Implements and Machinery per Acre of All Land in Farms, 1850-1930; 151D-G, Imports from and Exports to the United States, 1821-1929; 152B, D, 153A, D, Wealth per Capita, 1799-1922; 154B, D, F, H, K, L, Banks, Capital, 1800-1928; 155B, D, Federal Income Taxes per Capita, 1866,1928; 166, The World, Showing Possessions and Territorial Claims of the United States, etc.
c) Illustrating topics covered under the original plan but compiled on the basis of different data or with different symbols: Plate 7A, Oil and Gas Fields; 70E-O, Sources of Emigration to the United States, 1831-1929; 138A-E, Rates of Travel, 1800-1930; 160-165, Military History.
2. Maps drafted but not compiled by the Society:
a) Based wholly or in large part on maps prepared or used by Dr. Paullin: Plate 2A, Relief; 33, Indian Tribes and Linguistic Stocks, 1650; 34, Indian Battles, 1521-1890; 38-39, Explorations in the West and Southwest; 138F, Navigable Rivers, 1930; 138G, Canals and Canalized Rivers, 1930; 148-151A, Imports and Exports, 1701-1910.
b) Based on other maps: Plate 2B, Physical Divisions; 4-5, Climate; 6A, Coal Fields; 132, Reforms; 141H, J, Air Mail Routes in Operation, 1920 and 1927, 1931.
3. Maps drafted under Dr. Paullin's direction to which the Society has added data: Plate 6B, Distribution and Production of Iron Ore; 7B, Gold, Silver, and Copper Districts; 36B, Indian Reservations, 1930; 37, Indian Missions, 1567-1861; 139A, B, Railroads, 1850, 1860, and Overland Mail, 1850-1869.
4. Maps added by the Society as reproduced from other sources: Plate 8, Behaim Globe, 1492; 30B, Humboldt Map, 1811; 31B, Pike's Map of the Mississippi River, 1810; 142A, Agricultural Regions; 142B-144B, Agricultural Production (selected topics); 144C-145C, Improved Land, Acreage, 1850-1910, Land in Harvested Crops, 1919, 1929; 145D-146M, Improved Land, Increase in Acreage, 1850-1920, Improved Land, Decrease in Acreage, 1850-1910, Land in Harvested Crops, Increase and Decrease in Acreage, 1909-1929; 159B, Baltimore, 1801.
It is hoped that the foregoing paragraphs make sufficiently clear the general concept of the Atlas, some further avenues of research that its plates suggest, and the circumstances under which it has been produced. Unless one is much mistaken the Atlas will be a dynamic force in historical and geographical studies in this country for many years to come.
JOHN K. WRIGHT.
Note: No scales are shown on the diagrammatic maps in the Atlas. Scales applicable to most of these maps are given below.
Acknowledgments
The very first thing that appears in Charles O. Paullin’s and John K. Wright’s Atlas of the Historical Geography of the United States is an acknowledgment by its credited author that the work was not the product of his efforts and research alone. “The Atlas of the Historical Geography of the United States may be described as a composite work,” Paullin stressed in the opening sentence of the preface, “since many scholars have cooperated in its making.” The same is true of this enhanced edition of the Atlas: it is a decidedly composite work produced through the combined efforts of the staff and student interns of the Digital Scholarship Lab and with the generous support of the Andrew W. Mellon Foundation.
Robert K. Nelson designed the enhancements of the print maps, designed the interface, coded the site, and managed the project. Scott Nesbit first proposed developing an online edition, oversaw most of the research collecting and organizing historical and spatial evidence, and managed the student interns. Claire Clement georeferenced hundreds of maps, developed georeferencing guidelines and procedures for the project, and executed a variety of other GIS-related tasks. Nate Ayers georeferenced dozens of maps, did nearly all the graphics work for this edition, developed the introductory movie, and contributed substantially to its design. Justin Madron developed the geodatabase, oversaw the creation of vector data and polygons, and performed a number of other GIS-related tasks. Chris Kemp OCRed the text and helped develop markup guidelines. Rick Neal assisted with server and application administration. Edward L. Ayers lent the project “the benefit of his wide knowledge and expert judgment” (to borrow Paullin’s acknowledgment of the role that the eminent historian James Franklin Jameson played in creating the Atlas).
A number of undergraduate students, all but a couple from the University of Richmond, contributed substantially to this edition. Mary Brickle, Molly Courtney, Anthony Joga, Michael Kessinger, Mike Laventure, Tiffani Lewis-Lockhart, Grace Robinson, Stefan St. John, and Rebekah Yowell georeferenced maps. Courtney, St. John, and Darleen Underwood marked up text. Carlton Fleenor, Rachel Hall, Joga, and Beaumont Smith collected and cleaned historical spatial data. Josh Armstrong, Amanda Haislip, and Garrett Steele manipulated some of that data. Dan Casella scanned the pages of the Atlas.
We appreciate and thank the Carnegie Institution for Science for their willingness to let us use the Atlas of the Historical Geography of the United States in this digital edition.
If you have any comments or questions, please email Robert Nelson at rnelson2@richmond.edu.

About the Atlas
Over eighty years after it was originally published, Charles O. Paullin’s Atlas of the Historical Geography of the United States remains one of the most impressive and most useful atlases of American history. Containing nearly 700 individual maps spread across 166 plates, it addresses a broad range of issues. Beginning with a chapter consisting of 33 maps on the natural environment and a second containing 47 maps documenting the evolution of European and later American cartographic knowledge about North America, the atlas mapped an exhaustive number of historical topics: exploration and settlement of the continent, the location of colleges and churches, disputes over international and state boundaries, voting in presidential elections and in Congress, reforms from women’s suffrage to workmen’s compensation, transportation, industries, agriculture, commerce, the distribution of wealth, and military history.
For twenty-first-century audiences, it’s probably no surprise that it’s missing a few things as an historical atlas. Besides the fact that it’s now more than eighty years out of date, it is primarily focused on Americans of European descent—though, to be fair, it certainly contains a significant number of maps showing the geographic distribution of people of different ethnic and racial backgrounds. Yet whatever the atlas’s shortcomings, browsing through its many thoughtful and often beautiful maps one can’t help but be impressed. Anyone interested in American history before 1930 is almost certain to find many maps in the atlas that are both interesting and useful.
The Atlas in the Twentieth Century
From conception to publication, the atlas was three decades in the making. An outline for the atlas was first offered by John Franklin Jameson in 1902 when he proposed that the newly established Carnegie Institution of Washington should take on the task of developing “a really first rate atlas of American history.” Under the leadership of Paullin, a historian of the U.S. Navy, research for the atlas began in 1912 at the Carnegie Institution’s Department of Historical Research, which Jameson directed. Work on the atlas continued there for fifteen years, and in and in 1929 the Carnegie Institution arranged for the American Geographic Society (AGS) to complete the atlas. The eminent geographer John K. Wright was then the AGS’s librarian. He oversaw the completion of the atlas and was credited as its editor when it was published in 1932.
Upon its publication the Atlas of the Historical Geography of the United States received broad acclaimed. For the atlas, Paullin and Wright received the Loubat Prize, which was awarded every five years to the best work on the history, geography, or philology of North America. It received mostly glowing reviews, with two reviewers using the same phrase to describe the Atlas: “a monument to historical scholarship.” In the decades since its publication, it has been consulted and used by countless professional and lay historians, and a few of its maps (like those showing rates of travel) continue to be reproduced or adapted to this day.
The Atlas in the Twenty-First Century
Even as they produced an extraordinary work of historical and geographic scholarship, Paullin and Wright could imagine even more effective historical maps. The “unadaptable medium of the map,” Wright complained in the introduction to the atlas, presented a “large problem” for anyone interested in mapping history. While the printed map was well suited to “represent static conditions—the earth’s surface at any given moment,” history explores how something changed over time. Paullin and Wright developed a number of techniques to effectively show historical change, but they could imagine another better technique impossible in print. “The ideal historical atlas,” Wright proposed, “might well be a collection of motion-picture maps, if these could be displayed on the pages of a book without the paraphernalia of projector, reel, and screen.”
In this digital edition we’ve tried to bring—hopefully unobtrusively and respectfully—Paullin and Wright’s maps a bit closer to that ideal. First, with the exception of the historical maps from the cartography section and a handful of others (those that used polar projections, for example), we’ve georeferenced and georectified all of the maps from the atlas so that they can be overlaid consistently within a digital mapping environment. (Georeferencing is a process of linking points on a map to geographic coordinates, and georectification is a process of warping a map using those coordinates to properly align it within a particular projection, here web mercator.) High-quality scans of all of the maps as they appeared on the plates are available too.
Having georectified versions of these maps has made it possible to add a few kinds of functionality that are impossible in print. First, we’ve animated a number of maps. Series of maps that show how something developed over time—where settlements, colleges, and churches were located and where cotton, corn, and wheat were grown, for example—can now be set in motion to more easily spot patterns of change and persistence. Other maps that show movement—the centers of population, for instance, and the explorations of the continent by Spanish, French, and American explorers—are here animated where markers or pathways move across the underlying base map, transforming them into “motion-picture maps” without “projector, reel, and screen.” Any map marked with a ![]() in the table of contents is animated in some fashion.
in the table of contents is animated in some fashion.
To produce many of the maps in the atlas, Paullin and Wright availed themselves of mountains of statistics. In this edition we’ve annotated many of the atlas’s maps with those statistics. The maps on presidential voting, population, agricultural production, churches, colleges, and a number of others, all marked with a ![]() , can now be clicked on to access more detailed, raw statistics about a county or an institution.
, can now be clicked on to access more detailed, raw statistics about a county or an institution.
Throughout the spring of 2014 we will also be blogging about the atlas. In these posts we’ll try to provide context and analyze the maps in ways that we hope will illuminate the issues and themes they address.
Reusing and citing the Atlas
The copyright status of the Atlas is not entirely clear. It likely is the public domain, but that is not easy to confirm. Regardless, the Carnegie Institution of Science, whether or not they own copyright, has, in their words, "no objection to the use of the material for non-commercial, non-political, educational purposes." So, please feel free to print, take screenshots of, and reproduce both the scanned and georectified maps in the Atlas for such purposes.
If you are using the Chicago Manual of Style and want to cite the Atlas, we suggest:
- Charles O. Paullin, Atlas of the Historical Geography of the United States, ed. John K. Wright. Washington, D.C.: Carnegie Institution, 1932. Digital edition edited by Robert K. Nelson et al., 2013. http://dsl.richmond.edu/historicalatlas/.
For Those Interested in How this Site Was Built
A number of different technologies were used to develop this project:
- The digital mapping components of this site uses the Leaflet mapping framework.
- The maps were georeferenced and georectified using ArcGIS. Some georectified maps were cleaned up using Photoshop. Tiles were produced using the gdal2tiles python library.
- Data for the atlas was collected from a variety number of sources that are noted in the data popups. The National Historical Geographic Information Systems, the Inter-university Consortium for Political and Social Research, and the Atlas of Historical County Boundaries were particularly important sources of historical and spatial data. The data for the project is stored in a PostGIS database.
- The text was marked up using the TEI P5 XML specification.
Comments and Questions
If you have any comments or questions, please email Robert Nelson at rnelson2@richmond.edu.