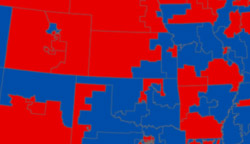
Voting America encourages users to think about US political history by allowing two types of comparison. Animations of a single type of map--say, measuring the winner of presidential elections at the county level--allow for comparisons across time. Users can also explore a single election by looking at patterns across a number of variables, including the percentage of votes won by parties, the winner of a given district, or the distribution of votes across the United States.